Every visitor, every entrance. Where they come from, how long they stay. Numbers your tenants, owners and marketing team can all trust.

people movements counted a year
accuracy, consistently monitored
of spending processed
faces or personal data stored
Tenants want the traffic outside their door. Owners want the trend. Marketing wants to know what worked.
Each of them gets a straight answer from the same data.

Doors, zones, catchment and the market, side by side. Built for the people who run the centre, as well as your data analysts.
Live counts at every door, car park link and travelator.
Zone density shows where people gather, how long they stay and what gets walked past.
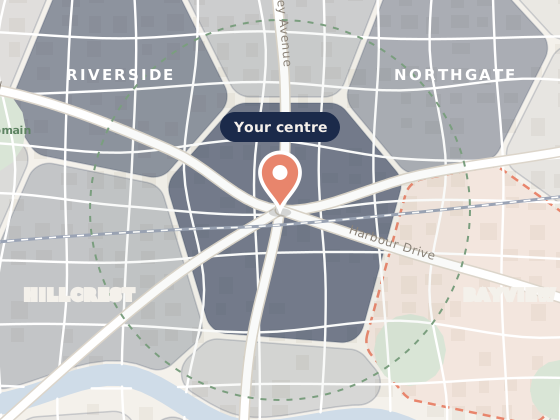
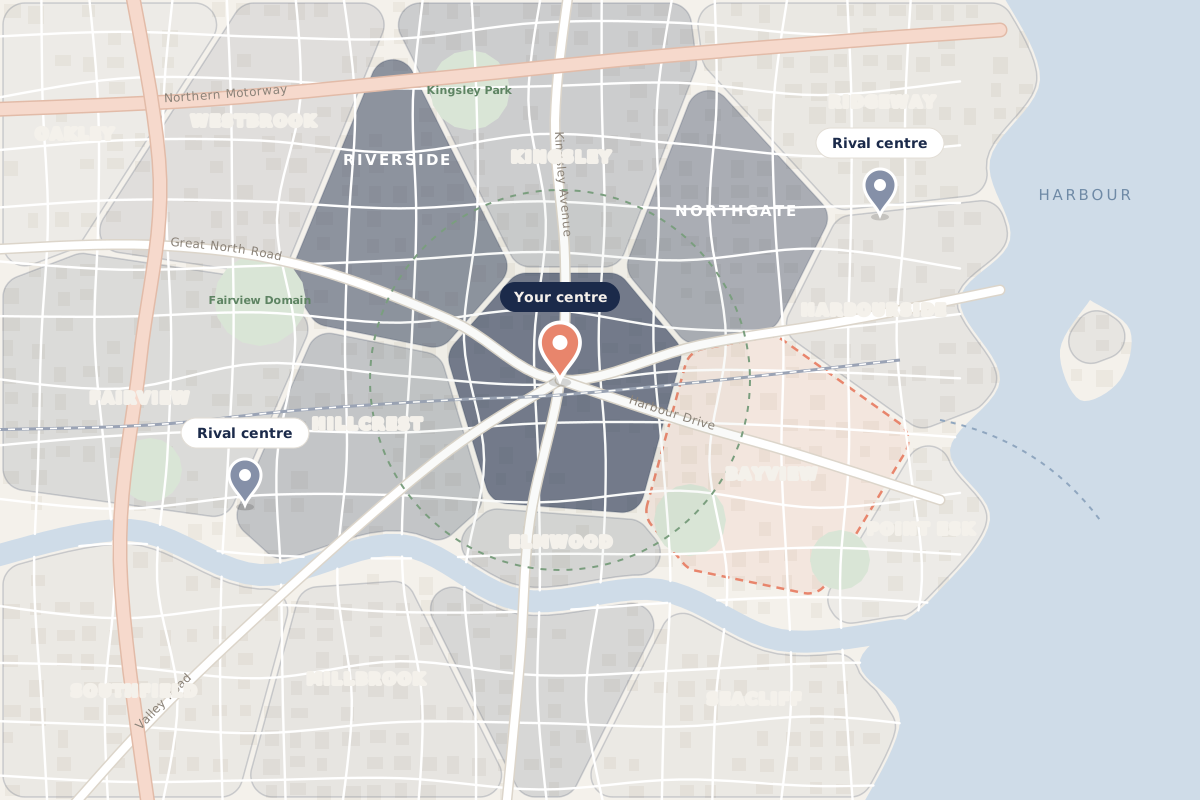
See which suburbs send you visitors and which ones you're missing.
Hansel & Gretel
Bayview: close by, under-drawn

 /PortfolioLast 4 weeks
Track performance across your portfolio and report trends to the board with confidence.
Walk prospective tenants through the traffic outside their door. Back every rent review with numbers.
Roster cleaning, security and concierge to real peaks, not last year's hunch.
See which campaigns and events brought people in and which suburbs to target next.
Hansel & Gretel by Bellwether
See where your visitors came from, how long they stayed and where they went next, including the other centres they visit.

We do the heavy lifting. Your team gets a dashboard on day one.
We map your entrances, zones and goals with your team.
Installed outside trading hours. No disruption to tenants.
Each sensor is calibrated to its space and audited by our team.
Your dashboard and weekly reports are ready from day one.
Bellwether counts movement, not people. Nothing that can single out a shopper.

Send footfall to Power BI, match it to tenant sales, or pull it through our API.






Every sensor is calibrated to its space and manually validated. Accuracy is consistently monitored above 95%.
No. Bellwether is anonymous by default. No faces and no personal data.
Yes. Bellwether connects to Power BI and offers a documented API and webhooks.
Yes. See every centre in your portfolio side by side.