Library visitor intelligence
Stop guessing how your library is really being used. Bellwether gives library leaders a high-definition lens into the visitor journey, revealing not just visitor counts, but movement patterns, dwell time, peak demand and the planning insights that improve the experience across your whole facility.

See how people move, where they settle, when demand surges and which spaces are quietly underperforming, so every decision about staffing, layout and funding is grounded in real evidence.
Today's libraries are part book collection, part study hub, part community venue and part out-of-home workplace for people seeking focus and connection. Whether you manage a municipal library network, a community branch, a civic hub or a specialised public venue, Bellwether helps you plan with real usage data instead of assumptions.
.png)
See how demand shifts across the day, week and season for each branch or floor.
Learn more ».png)
Understand how children's zones, study areas and community hubs are used differently.
Learn more ».png)
Deploy librarians and support staff more effectively, based on real occupancy and dwell patterns.
Learn more »Library analytics should show more than a daily headcount. Bellwether helps you understand where people go, how long they stay, when demand peaks and which areas are carrying the most pressure, so teams can improve the experience while using resources more effectively.
.png)
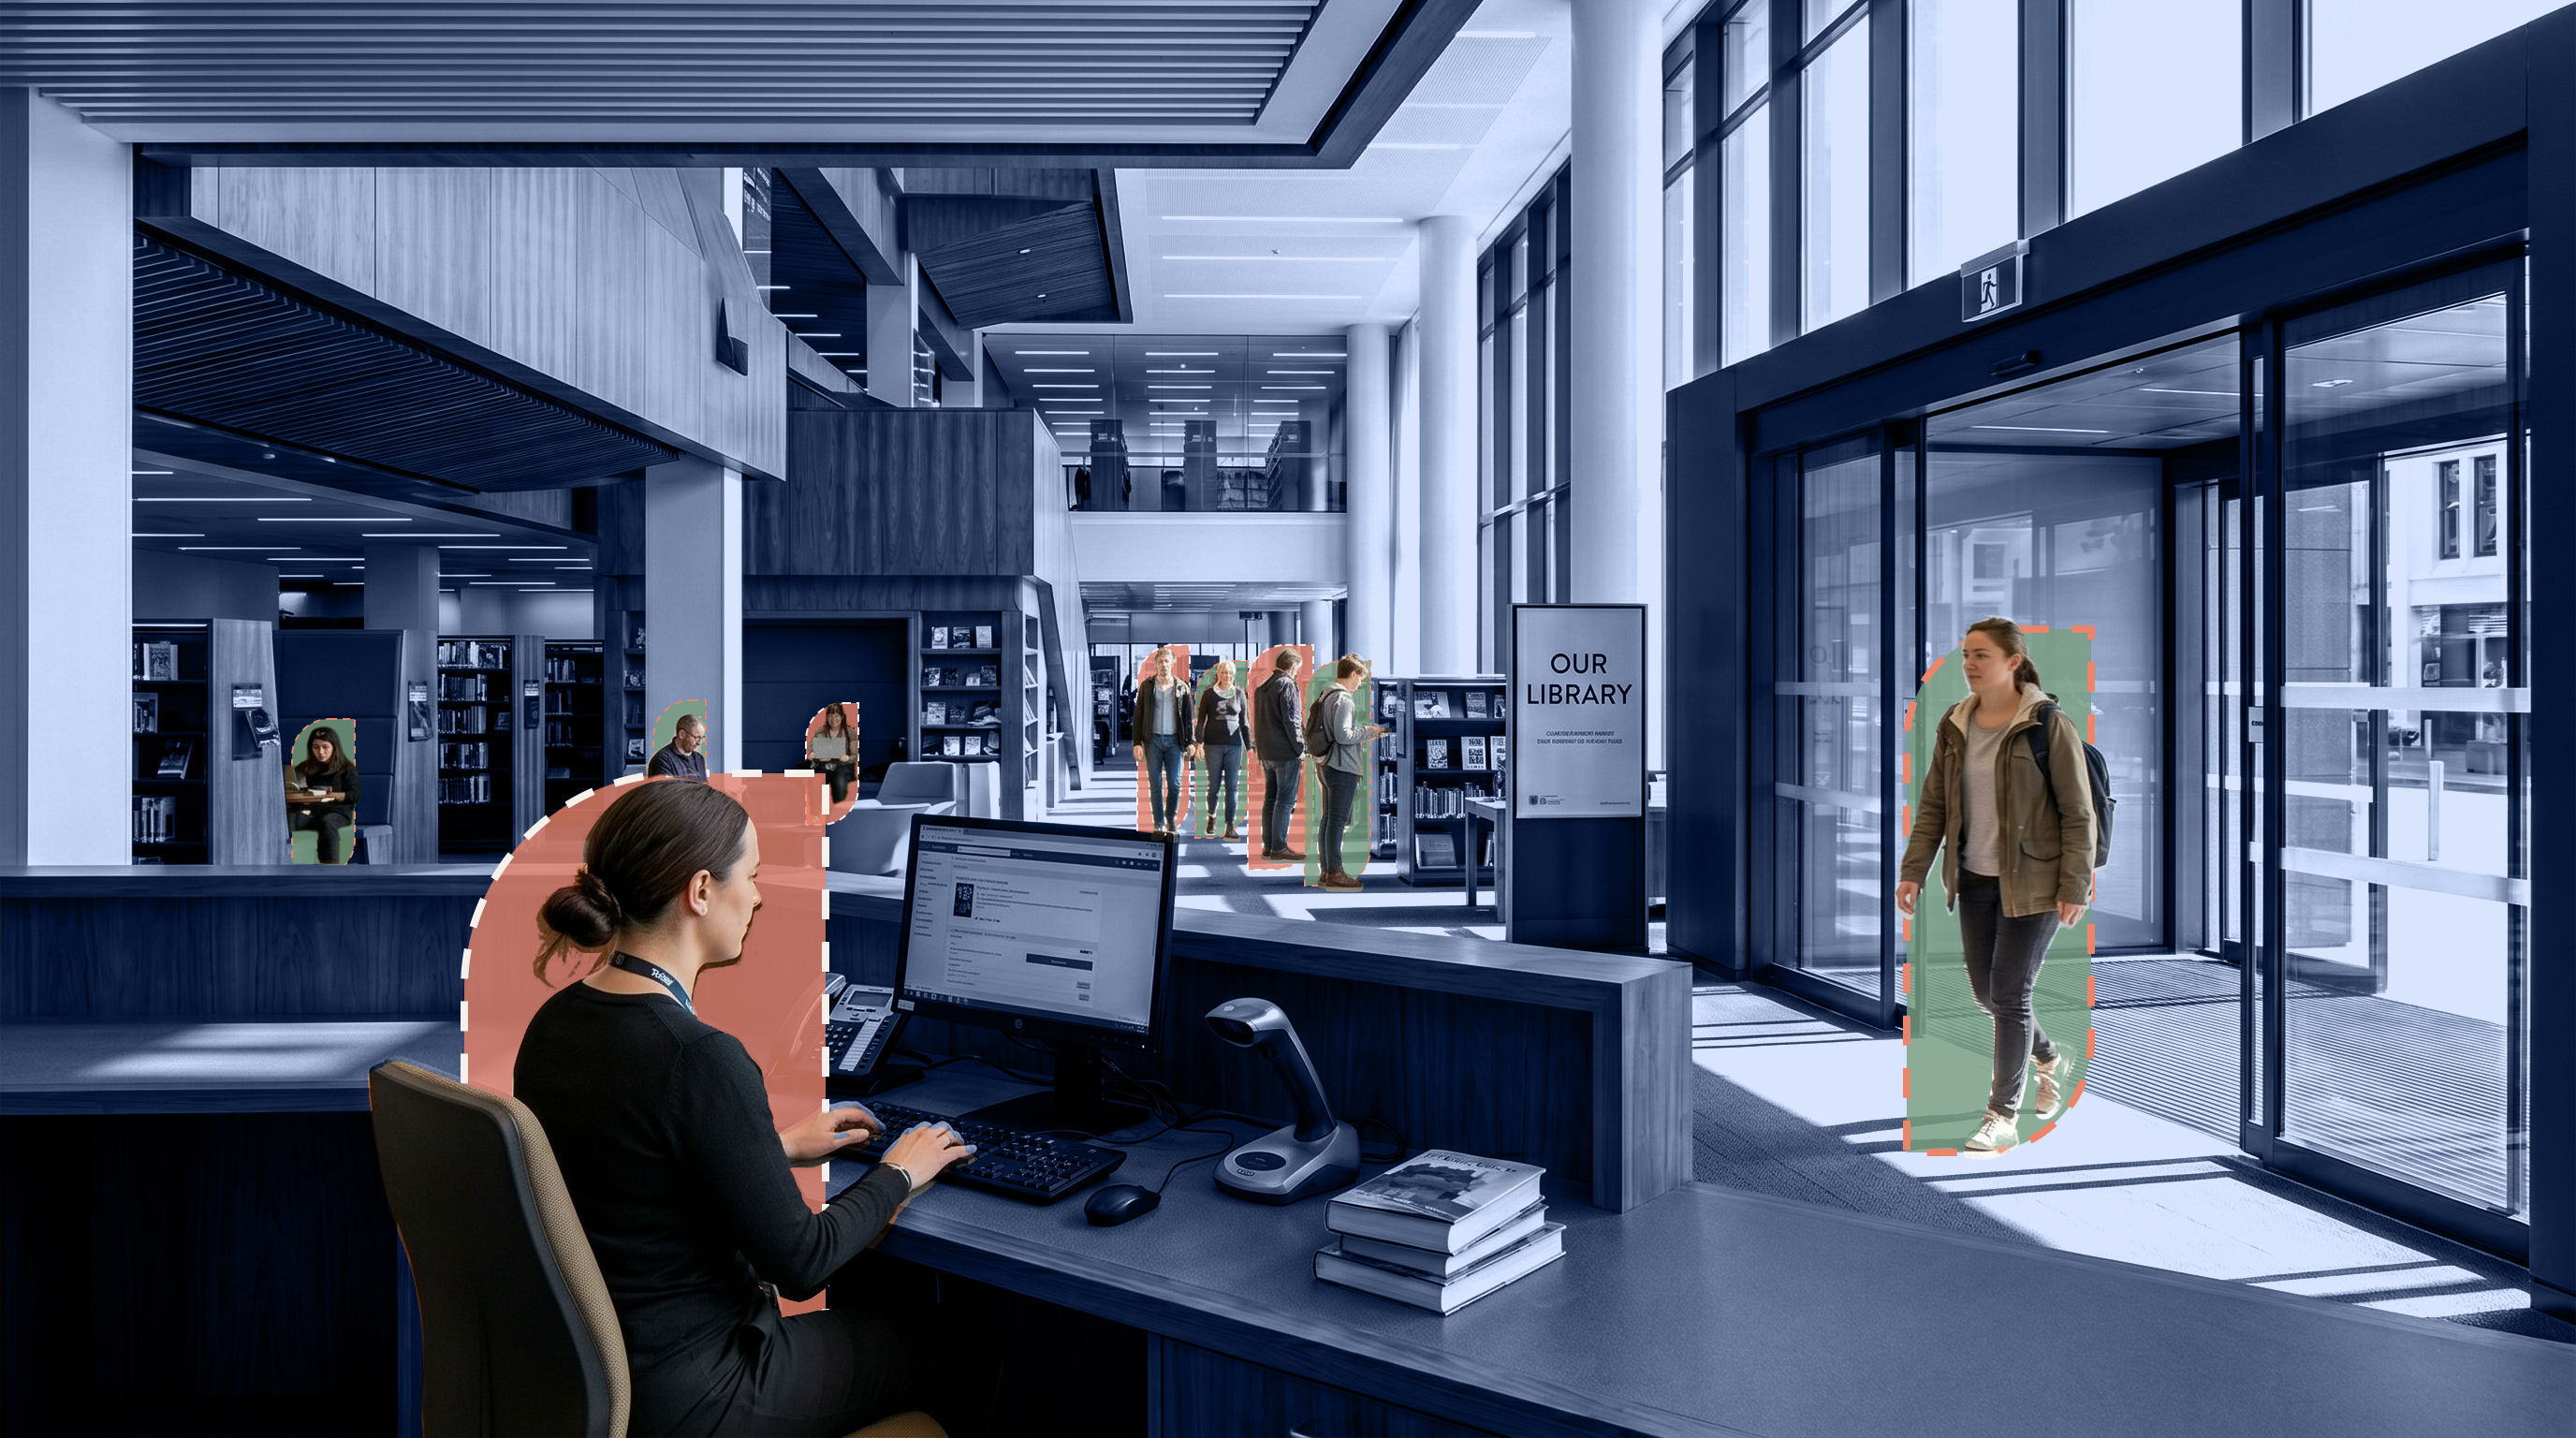
Bellwether uses accurate overhead 3D people-counting sensors to track entries, exits and live occupancy at entrances, stairwells and key thresholds. You can see how many people are in the building now, how usage changes hour by hour and when occupancy builds in entrances, service desks, computer bays and shared spaces.


Different library spaces behave differently throughout the day and across the week. Bellwether helps teams understand the rhythm of each area so staffing, cleaning, safety and services can match how the building is really being used.
.png)
See when families and school groups arrive, how long visits last and when extra hosting, supervision or tidying is required.
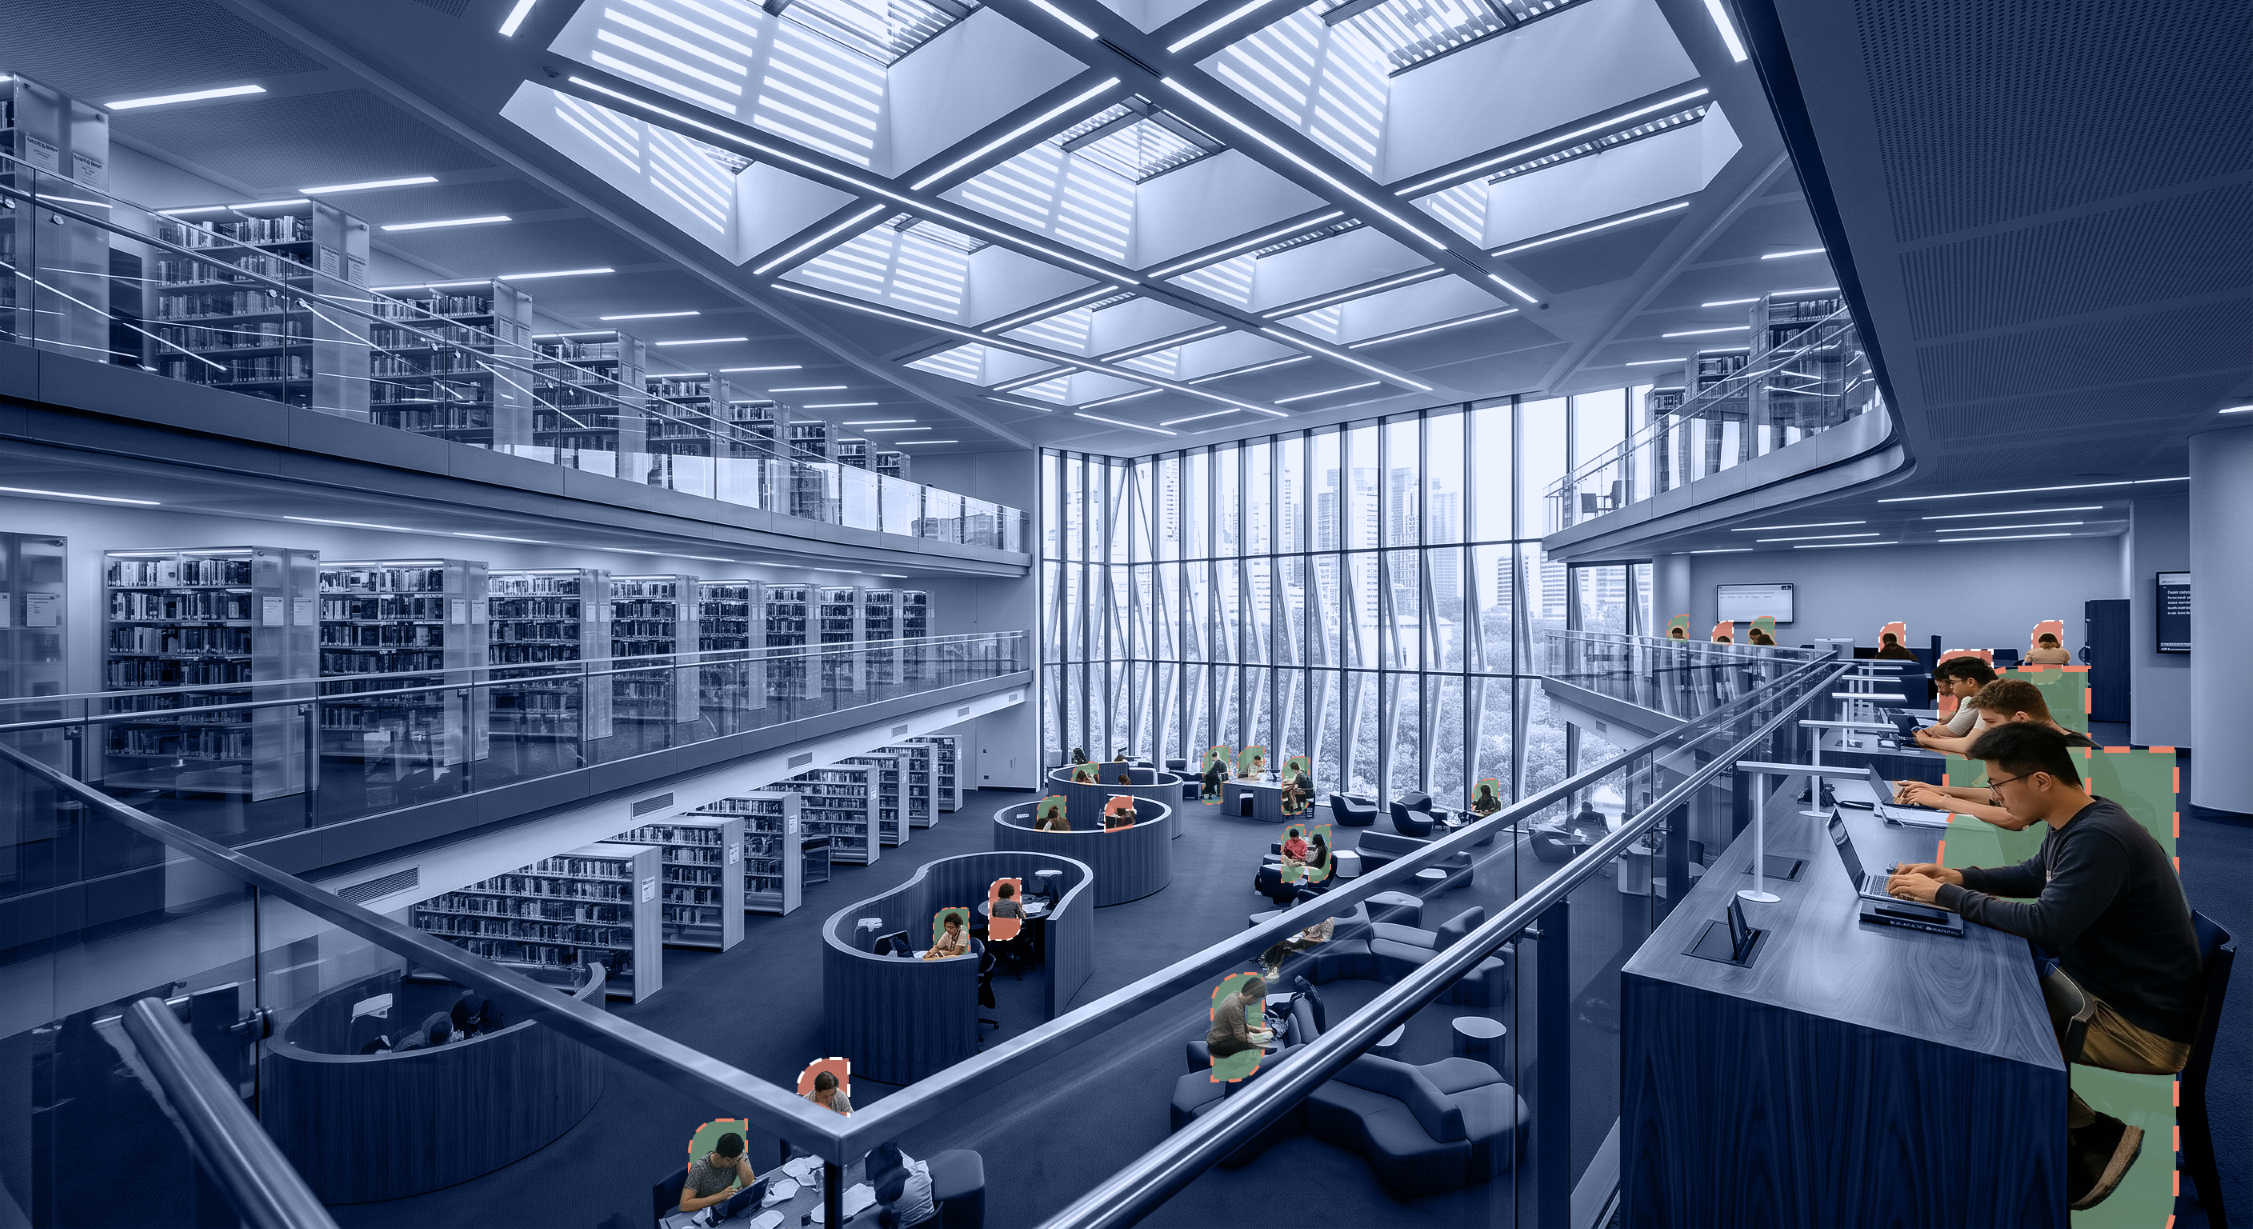
Measure demand for quiet, longer-stay environments and know when capacity pressure may impact visitor comfort.
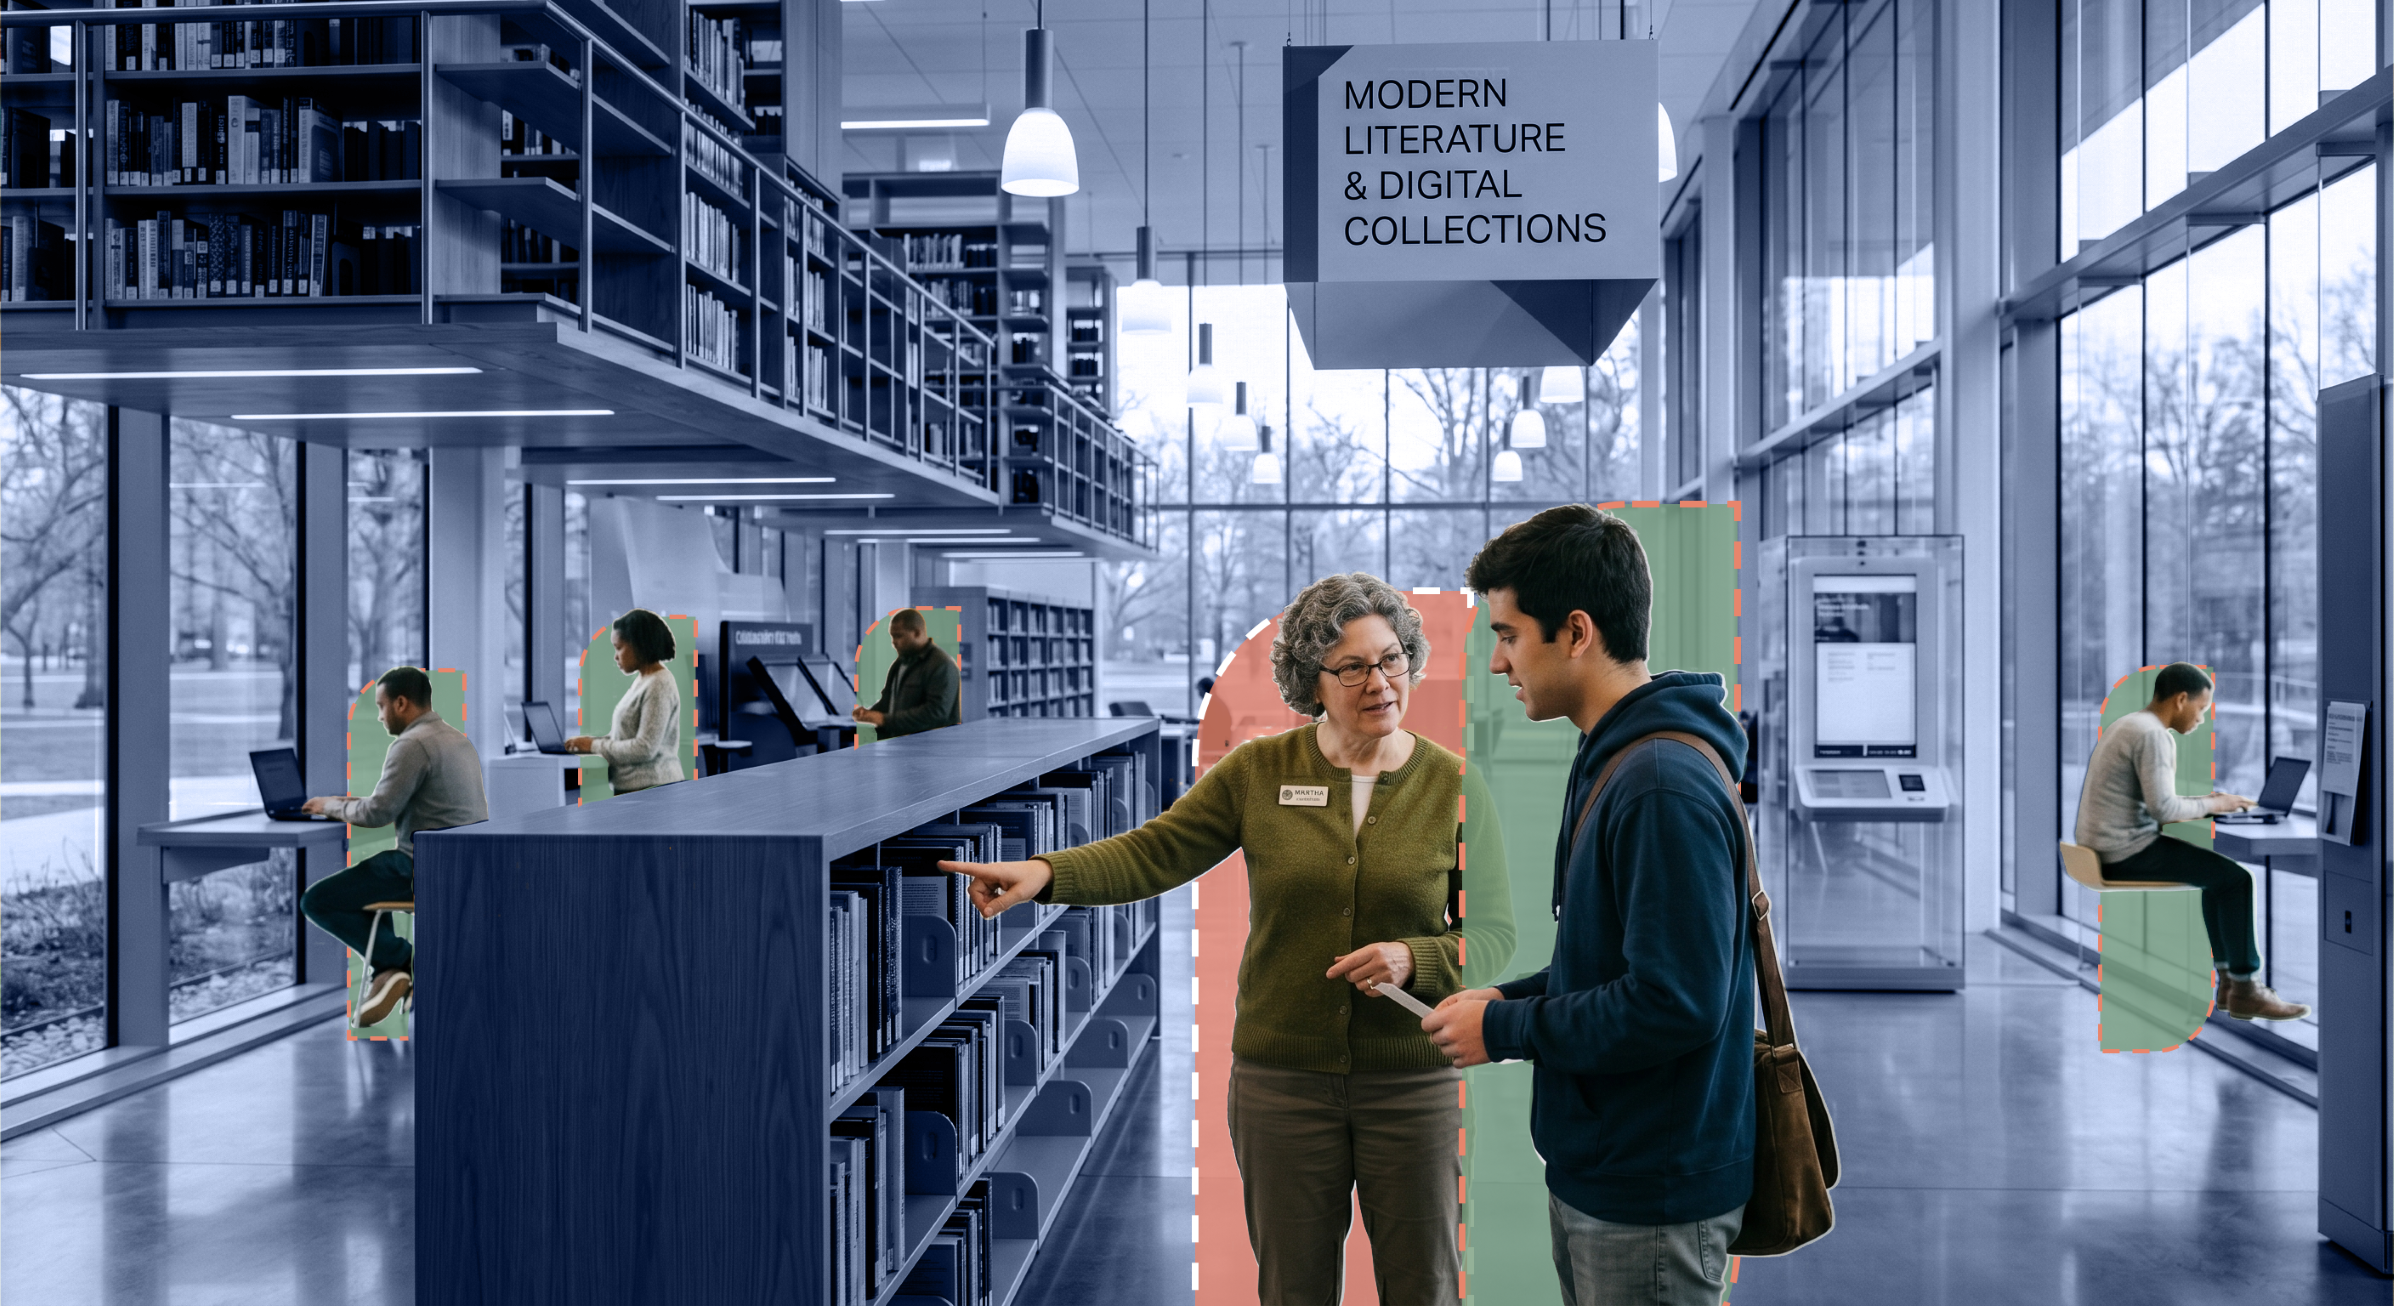
Track how shared tables, collaboration areas and device desks are used by remote workers and people seeking connection during the day.
Bellwether shows how visitors move through children's areas, quiet rooms, open study zones, meeting rooms and community hub spaces. You can identify visitor bottlenecks and navigation patterns, then reconfigure book stacks, desks and furniture layouts to create smoother movement from entrance to exit.
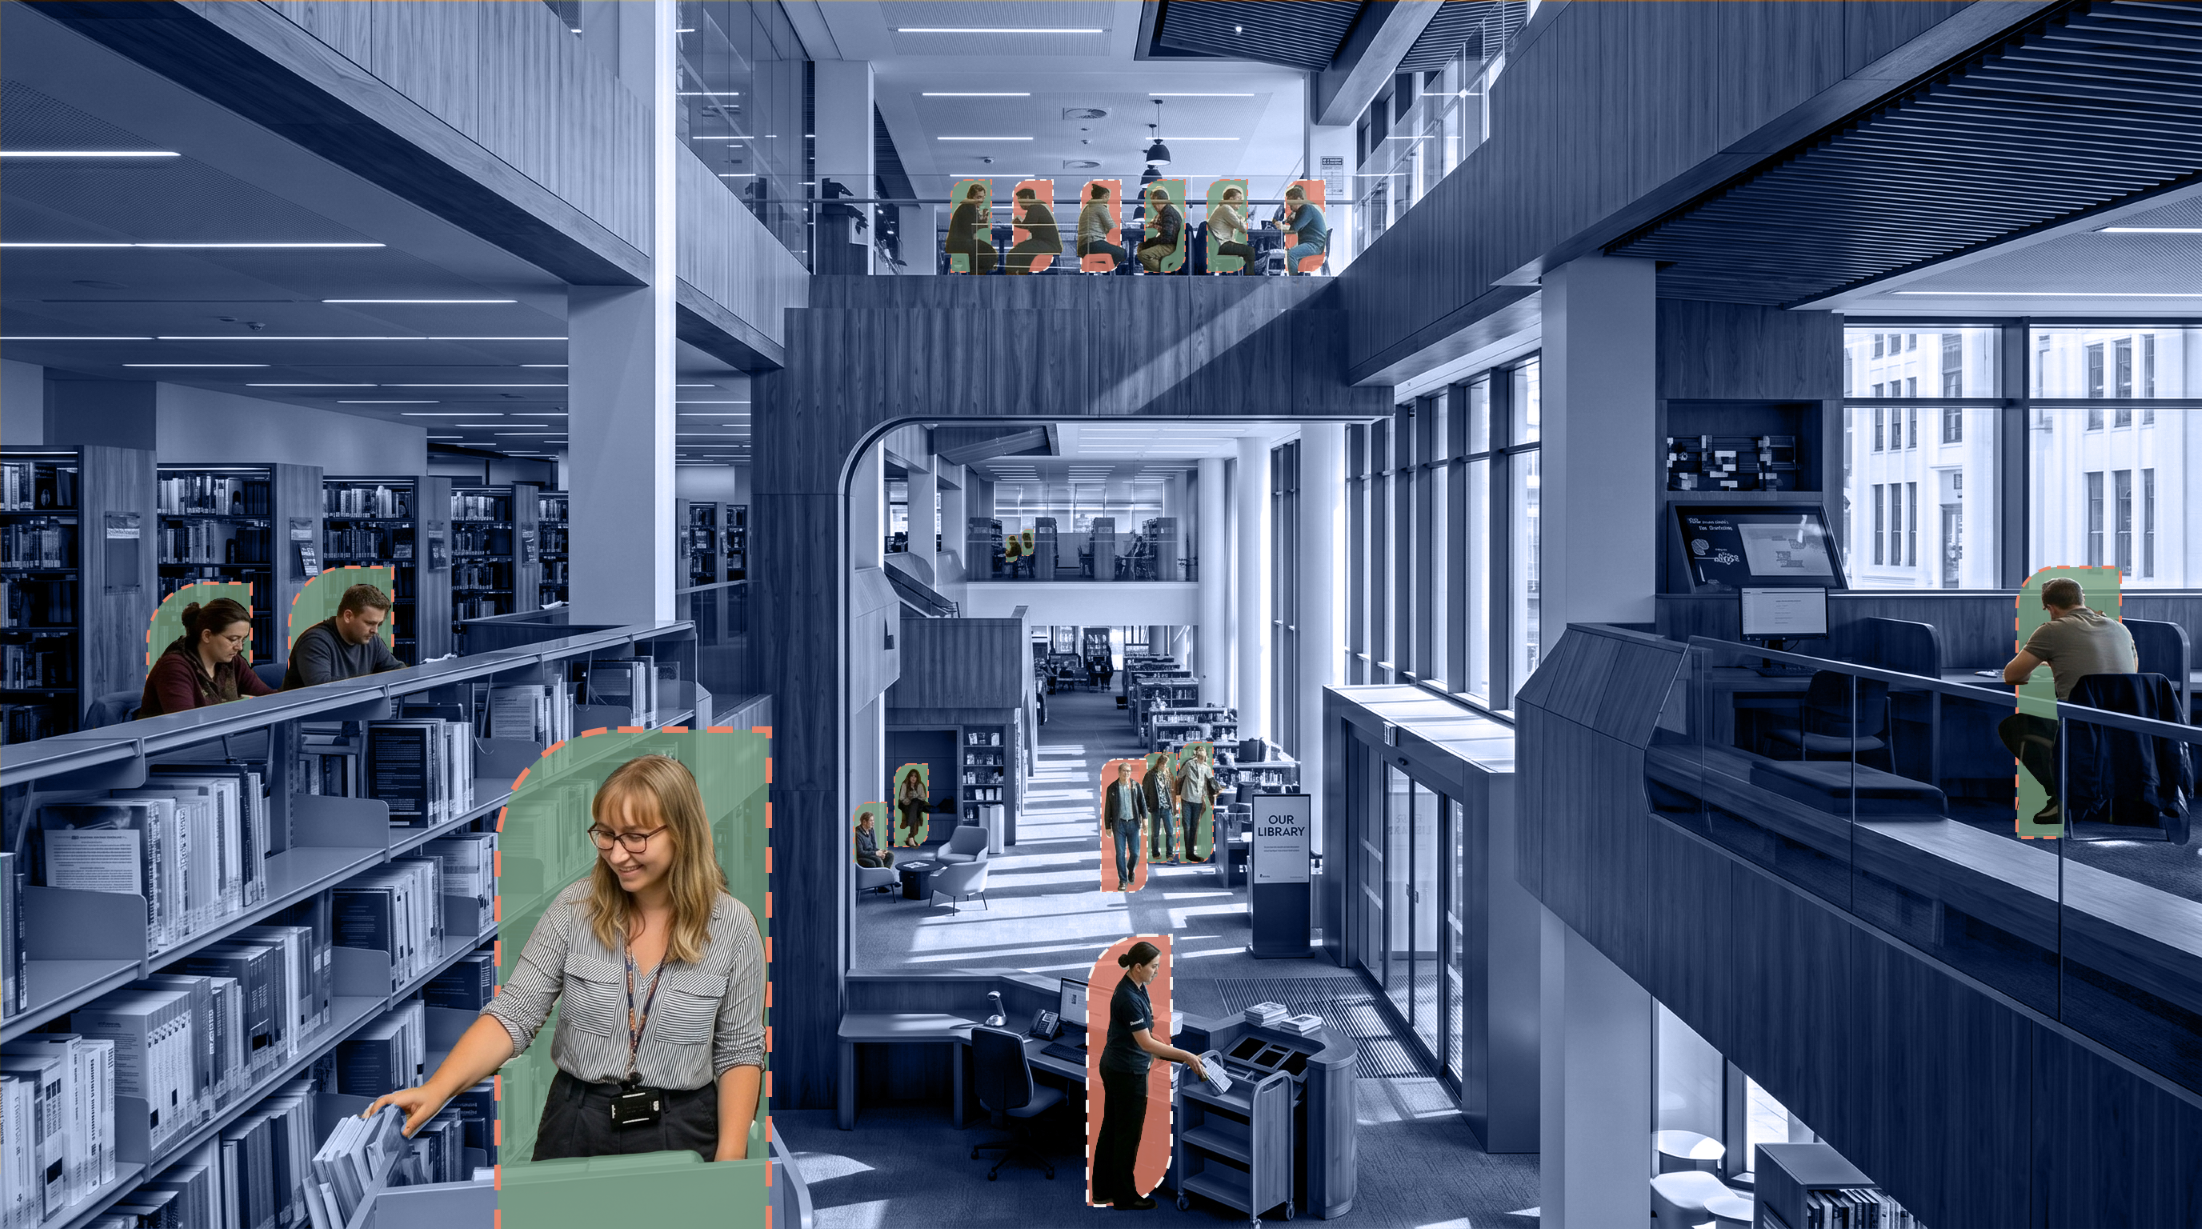
See which pathways are overused
See which pathways are overused and where queues tend to form.
Compare arrivals
Compare arrivals at different entrances and service points.
Test new layouts
Test new layouts or signage and measure how they change flow and distribution.
Dwell-time analytics reveal which hubs, collections, service desks and shared spaces truly hold attention, and which are only briefly visited. You can determine which areas offer the highest engagement or educational value and identify library cold zones that may need new programs, better lighting, seating or signage.
Request a library briefing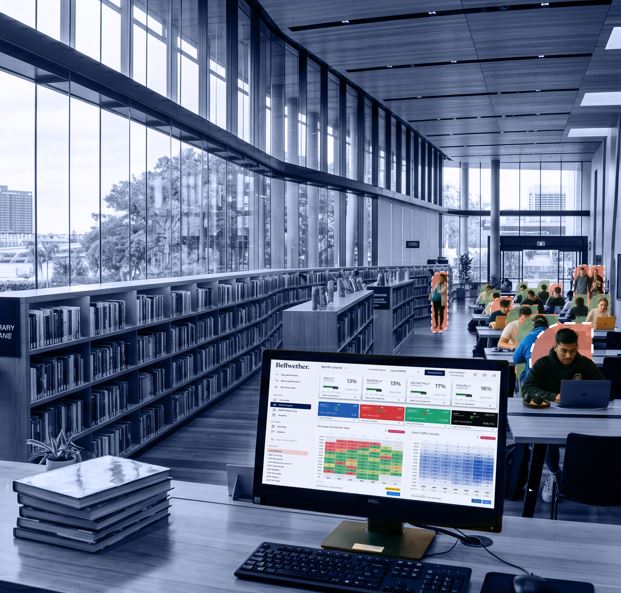
Master daily operations
Bellwether turns occasional snapshots into continuous clarity so library managers can align operations with actual visitor behaviour. Instead of relying on fixed rosters or manual counts, you can match resources to the evolving pattern of each day.
Your privacy is our top priority
Libraries are community spaces first. Bellwether's visitor analytics focus on anonymous counts, occupancy and movement patterns, not on identifying individual people.
Deployments are designed to support privacy-aware operation and to sit comfortably within existing governance and compliance frameworks, including GDPR-aligned approaches where required.
Bellwether combines accurate footfall technology with spatial intelligence and density sensors to give libraries a continuous, high-precision view of how public spaces are performing. The focus is on reliable, anonymous insights that support better decisions without disrupting the visitor experience.
Footfall Technology
Discrete, non-intrusive overhead sensors that count entry and exit traffic separately. Advanced 3D lens technology with manual calibration to consistently maintain verified accuracy above 95%.
Spatial Intelligence
Sleek, compact sensors deployed subtly to capture crowd flow in dynamic zones. Zone-detection inferencing technology monitors occupancy in real time, identifying when a space hits its maximum-efficiency threshold.
Secure funding and validate decisions
Funding bodies and councils now expect more than visitor totals. Bellwether provides the proof of concept and year-on-year data required to justify layout renovations, branch expansions and future funding requests. Leadership teams can show exactly how spaces are used, how community patterns are changing and where investment will have the greatest impact.
Support grant and budget applications with objective occupancy, dwell and flow data.
Demonstrate the impact of refurbishments, new study areas or expanded community hubs on real usage.
Report trends across branches, time periods and audience types using consistent measures rather than manual counts.

Library visitor intelligence is the use of people counting, occupancy monitoring, movement analysis and dwell-time data to understand how a library is really being used, not just how many people came through the door. It helps library managers see peak demand, crowded zones, cold zones and changing patterns of use so staffing, layout and programming decisions are based on evidence rather than guesswork.
Libraries can measure occupancy and footfall using overhead 3D people-counting sensors that track entries and exits separately at building and zone level. With accurate hardware and smart software, managers can monitor live occupancy, daily visitor counts and hourly trends with verified accuracy above 95%, instead of relying on manual clickers or occasional counts.
Library dwell-time analytics measure how long visitors remain in defined areas such as children's sections, study zones, computer bays or community hubs. This shows which spaces are truly sticky and engaging, and which are cold zones where visitors only pass through quickly, helping librarians improve layout, programming and resource allocation.
Visitor analytics provide objective evidence about occupancy, peak demand, space utilisation and changes in community use over time. Libraries can use this data to support grant applications, justify branch expansions, validate renovation projects and demonstrate the impact of extended hours or new programs on real community behaviour.
Yes. Bellwether shows when libraries are busiest by hour, day and season, and which zones experience the highest demand. This allows managers to align librarians, front-of-house staff, security and cleaning schedules to actual usage patterns, improving service delivery and operational efficiency.

